The 1965 Los Angeles Dodgers season was the 76th season for the Los Angeles Dodgers franchise in Major League Baseball (MLB), their 8th season in Los Angeles, California, and their 4th season playing their home games at Dodger Stadium in Los Angeles California. The Dodgers finished the regular-season with a 97–65 record, which earned them the NL pennant by two games over their arch-rivals, the San Francisco Giants . The Dodgers went on to win the World Series in seven games over the Minnesota Twins .
Offseason
Regular season
Season recap
The Dodgers won the World Series in 1963, but injuries and poor play saw them fall to 6th place in 1964. Despite their weak offense and the trade of power hitting Frank Howard for Claude Osteen during the off season, they were expected to contend in 1965 with their strong pitching. However, one month into the season, they lost their best hitter Tommy Davis when he fractured his ankle sliding into second base. Most experts thought this ended any hope the Dodgers had of winning the pennant. To replace Davis, the club called up journeyman Lou Johnson ; his infectious cheerful attitude and knack for timely hitting helped keep the club in contention.
The National League pennant race was a thriller, with 6 teams (the Dodgers, Giants, Pirates, Reds, Braves, and Phillies) in contention throughout a summer that saw the Dodgers, Giants, Braves, and Reds all take their turns in first place. With these 6 teams tightly bunched heading into September, the Giants went on a 14-game winning streak to take a 4+ 1 ⁄2 -game lead with two weeks to play. Then the Dodgers went on a 13-game winning streak, and won 15 of their last 16 games to win the pennant by 2 games over the Giants.
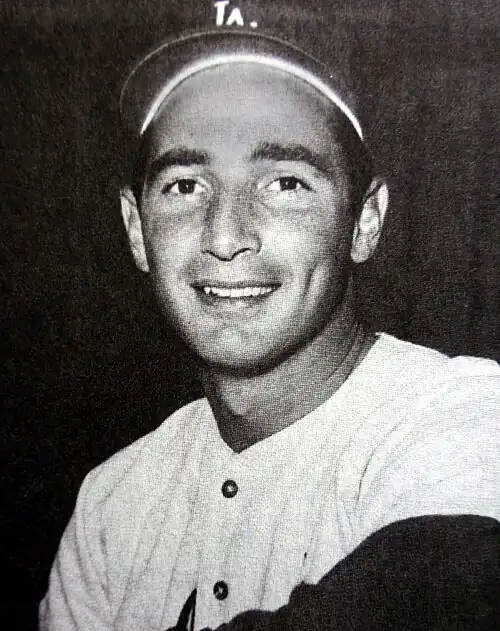
The Dodgers were led by shortstop Maury Wills with 94 stolen bases, Sandy Koufax (26–8, 2.04 E.R.A. and a then record 382 strikeouts), and Don Drysdale (23–12, 2.77 E.R.A.) Drysdale also chipped in with 7 home runs and was the club's only .300 hitter.
Season standings
Record vs. opponents
Sources: [1] [2] [3] [4] [5] [6] [7] [8] [9] [10]
Team
CHC
CIN
HOU
LAD
MIL
NYM
PHI
PIT
SF
STL
Chicago
—
7–11
8–10
8–10
9–9
11–7–1
8–10
5–13
6–12
10–8–1
Cincinnati
11–7
—
12–6
6–12
12–6
11–7
13–5
8–10
6–12
10–8
Houston
10–8
6–12
—
5–13
4–14
14–4
6–12
8–10
3–15
9–9
Los Angeles
10–8
12–6
13–5
—
10–8
12–6
9–9
9–9
10–8
12–6
Milwaukee
9–9
6–12
14–4
8–10
—
13–5
6–12
9–9
10–8
11–7
New York
7–11–1
7–11
4–14
6–12
5–13
—
7–11–1
4–14
5–13
5–13
Philadelphia
10–8
5–13
12–6
9–9
12–6
11–7–1
—
8–10
8–10
10–7
Pittsburgh
13–5
10–8
10–8
9–9
9–9
14–4
10–8
—
11–7–1
4–14
San Francisco
12–6
12–6
15–3
8–10
8–10
13–5
10–8
7–11–1
—
10–8
St. Louis
8–10–1
8–10
9–9
6–12
7–11
13–5
7–10
14–4
8–10
—
Opening Day lineup
Notable transactions
Roster
1965 Los Angeles Dodgers
Roster
Pitchers
Catchers
Infielders
Outfielders
Manager
Coaches
Game log
Regular season
Legend
Dodgers win
Dodgers loss
Postponement
Clinched pennant
Bold Dodgers team member
1965 regular season game log: 97–65 (Home: 50–31; Away: 47–34)[ 6]
April: 10–5 (Home: 7–4; Away: 3–1)
#
Date
Time (PT)
Opponent
Score
Win
Loss
Save
Time of Game
Attendance
Record
Box/
1 11:00 a.m. PST @ Mets W 6–1 Drysdale (1–0) Jackson (0–1) — 2:23 37,999 1–0 W1
2 5:15 p.m. PST @ Pirates W 3–1 Osteen (1–0) Gibbon (0–1) — 1:58 7,770 2–0 W2
— 5:15 p.m. PST @ Pirates Postponed (rain); Makeup: July 11
3 5:05 p.m. PST @ Phillies L 2–3 Short (2–0) Drysdale (1–1) Baldschun (1) 2:23 17,021 2–1 L1
4 10:35 a.m. PST @ Phillies W 6–2 Koufax (1–0) Belinsky (0–1) — 2:43 11,107 3–1 W1
5 8:00 p.m. PST Mets L 2–3 Spahn (1–0) Osteen (1–1) — 2:37 36,161 3–2 L1
6 8:00 p.m. PST Mets W 5–1Drysdale (2–1) Willey (0–1) Miller (1) 3:09 18,134 4–2 W1
7 8:00 p.m. PST Mets W 2–1 Koufax (2–0) Fisher (0–1) — 2:12 20,888 5–2 W2
8 8:00 p.m. PST Phillies W 4–0 Podres (1–0) Bunning (1–2) — 1:58 29,120 6–2 W3
9 8:00 p.m. PST Phillies W 9–3 Osteen (2–1) Belinsky (0–2) — 2:47 36,500 7–2 W4
10 1:00 p.m. PDT Phillies L 4–6 Herbert (1–0) Drysdale (2–2) Baldschun (2) 2:42 25,766 7–3 L1
11 8:00 p.m. PDT Phillies L 3–4 Short (3–1) Koufax (2–1) Baldschun (3) 3:00 24,703 7–4 L2
12 8:00 p.m. PDT Pirates W 5–4 Reed (1–0) Gibbon (0–3) Miller (2) 2:54 17,630 8–4 W1
13 8:00 p.m. PDT Pirates L 0–2 Veale (2–0) Osteen (2–2) — 2:05 17,464 8–5 L1
14 8:00 p.m. PDT Giants W 2–1 Drysdale (3–2) Marichal (3–2) — 2:13 30,219 9–5 W1
15 8:00 p.m. PDT Giants W 6–3 Miller (1–0) Bolin (0–3) — 3:02 48,586 10–5 W2
May: 19–12 (Home: 11–8; Away: 8–4)
#
Date
Time (PT)
Opponent
Score
Win
Loss
Save
Time of Game
Attendance
Record
Box/
16 8:00 p.m. PDT Giants W 4–2 Purdin (1–0) Perry (1–2) Brewer (1) 2:27 49,758 11–5 W3
17 1:00 p.m. PDT Giants L 2–4 (10) Sanford (2–1) Miller (1–1) Linzy (1) 2:43 40,439 11–6 L1
18 6:05 p.m. PDT @ Reds W 8–6 Brewer (1–0) Jay (1–1) — 2:30 9,767 12–6 W1
19 6:05 p.m. PDT @ Reds W 4–2 Koufax (3–1) O'Toole (0–4) — 2:38 9,753 13–6 W2
20 6:05 p.m. PDT @ Reds W 4–3 Podres (2–0) Tsitouris (2–2) Miller (3) 2:20 7,821 14–6 W3
21 8:15 p.m. PDT @ Giants W 4–3 Osteen (3–2) Henry (2–1) — 2:26 33,977 15–6 W4
22 1:00 p.m. PDT @ Giants W 9–0 Drysdale (4–2) Herbel (1–2) — 2:22 37,548 16–6 W5
23 1:00 p.m. PDT @ Giants L 3–6 Marichal (5–2) Koufax (3–2) — 2:48 40,596 16–7 L1
24 8:00 p.m. PDT Astros W 3–2 (10) Miller (2–1) Woodeshick (1–2) — 2:44 22,535 17–7 W1
25 8:00 p.m. PDT Astros L 1–2 Giusti (6–0) Osteen (3–3) — 1:57 21,086 17–8 L1
26 8:00 p.m. PDT Astros W 4–2 Drysdale (5–2) Nottebart (0–2) — 2:06 19,302 18–8 W1
27 8:00 p.m. PDT Astros W 3–0 Koufax (4–2) Bruce (1–4) — 2:05 20,963 19–8 W2
28 8:00 p.m. PDT Cubs L 1–2 Buhl (4–2) Purdin (1–1) Abernathy (8) 2:23 26,356 19–9 L1
29 1:00 p.m. PDT Cubs W 3–1 Miller (3–1) Ellsworth (3–3) Brewer (2) 2:02 22,047 20–9 W1
30 (1) 1:00 p.m. PDT Cubs L 3–5 (10) Jackson (3–3) Perranoski (0–1) — 2:38 — 20–10 L1
31 (2) 4:13 p.m. PDT Cubs W 3–2 Drysdale (6–2) McDaniel (0–1) — 2:22 45,739 21–10 W1
32 5:30 p.m. PDT @ Astros W 5–3 (11) Koufax (5–2) Bruce (1–5) Miller (4) 2:59 40,858 22–10 W2
33 5:30 p.m. PDT @ Astros L 1–4 Johnson (3–1) Brewer (1–1) Woodeshick (2) 2:07 22,220 22–11 L1
34 5:30 p.m. PDT @ Astros W 4–2 (14) Purdin (2–1) MacKenzie (0–2) Drysdale (1) 4:04 30,885 23–11 W1
35 11:30 a.m. PDT @ Cubs L 3–4 Ellsworth (4–3) Drysdale (6–3) — 2:22 4,716 23–12 L1
36 11:30 a.m. PDT @ Cubs W 3–1 Koufax (6–2) Koonce (3–2) — 2:30 17,922 24–12 W1
37 11:30 a.m. PDT @ Cubs L 2–3 (16) Ellsworth (5–3) Reed (1–1) — 4:09 17,139 24–13 L1
38 8:00 p.m. PDT Cardinals L 4–6 Stallard (3–1) Osteen (3–4) Schultz (1) 3:11 22,987 24–14 L2
39 8:00 p.m. PDT Cardinals W 2–0 Drysdale (7–3) Gibson (8–1) — 1:41 28,515 25–14 W1
40 8:00 p.m. PDT Cardinals L 1–2 Simmons (3–5) Koufax (6–3) — 2:26 30,794 25–15 L1
41 8:00 p.m. PDT Braves W 3–2 Podres (3–0) Lemaster (2–5) — 2:02 19,001 26–15 W1
42 8:00 p.m. PDT Braves L 4–5 O'Dell (3–2) Osteen (3–5) — 2:20 30,107 26–16 L1
43 2:15 p.m. PDT Braves W 5–3 Drysdale (8–3) Carroll (0–1) — 2:28 23,707 27–16 W1
44 1:00 p.m. PDT Reds W 12–5 Koufax (7–3) Ellis (7–2) — 2:43 36,309 28–16 W2
45 (1) 1:00 p.m. PDT Reds W 4–3 Perranoski (1–1) Maloney (5–1) — 2:44 — 29–16 W3
46 (2) 4:19 p.m. PDT Reds L 1–6 Jay (3–1) Osteen (3–6) — 2:14 50,997 29–17 L1
June: 17–14 (Home: 6–7; Away: 11–7)
#
Date
Time (PT)
Opponent
Score
Win
Loss
Save
Time of Game
Attendance
Record
Box/
47 6:00 p.m. PDT @ Cardinals W 4–1 Drysdale (9–3) Washburn (3–3) Perranoski (1) 2:46 17,560 30–17 W1
48 6:00 p.m. PDT @ Cardinals W 11–10 Brewer (2–1) Schultz (1–1) Miller (5) 3:19 19,946 31–17 W2
49 6:00 p.m. PDT @ Braves L 2–5 Blasingame (6–4) Miller (3–2) — 2:50 5,760 31–18 L1
50 11:30 a.m. PDT @ Braves L 1–9 Cloninger (7–4) Podres (3–1) — 2:20 4,116 31–19 L2
51 (1) 11:00 a.m. PDT @ Braves W 4–0 Drysdale (10–3) Kelley (0–1) — 2:20 — 32–19 W1
52 (2) 1:50 p.m. PDT @ Braves L 4–5 Lemaster (3–5) Reed (1–2) O'Dell (6) 2:35 17,175 32–20 L1
53 5:05 p.m. PDT @ Phillies W 14–3 Koufax (8–3) Burdette (0–3) — 3:02 23,345 33–20 W1
54 5:05 p.m. PDT @ Phillies W 2–1 Osteen (4–6) Bunning (5–5) Perranoski (2) 2:49 14,975 34–20 W2
55 5:05 p.m. PDT @ Phillies L 3–7 Short (5–6) Kekich (0–1) — 3:01 16,241 34–21 L1
56 5:05 p.m. PDT @ Phillies L 0–4 Herbert (3–3) Podres (3–2) — 1:58 19,467 34–22 L2
57 5:00 p.m. PDT @ Mets W 2–1 Drysdale (11–3) Spahn (4–7) — 2:16 55,023 35–22 W1
58 11:15 a.m. PDT @ Mets W 5–0Koufax (9–3) Jackson (2–8) — 2:50 38,915 36–22 W2
59 (1) 10:00 a.m. PDT @ Mets W 5–2 Osteen (5–6) Fisher (5–6) Miller (6) 2:41 — 37–22 W3
60 (2) 1:16 p.m. PDT @ Mets W 4–3 Perranoski (2–1) Kroll (3–5) Podres (1) 3:25 57,175 38–22 W4
61 8:00 p.m. PDT Giants L 1–2 Marichal (10–5) Drysdale (11–4) — 2:16 52,357 38–23 L1
62 8:00 p.m. PDT Giants W 2–1 Koufax (10–3) Shaw (6–4) — 2:36 44,499 39–23 W1
63 8:00 p.m. PDT Giants W 3–0 Osteen (6–6) Perry (6–6) — 2:24 40,707 40–23 W2
64 8:00 p.m. PDT Phillies L 2–4 Short (7–6) Podres (3–3) — 2:23 30,401 40–24 L1
65 8:00 p.m. PDT Phillies W 4–0 Willhite (1–0) Herbert (3–4) Perranoski (3) 2:19 20,518 41–24 W1
66 (1) 1:00 p.m. PDT Mets W 2–1 Koufax (11–3) Spahn (4–9) — 1:52 — 42–24 W2
67 (2) 3:27 p.m. PDT Mets L 2–3 Miller (1–0) Drysdale (11–5) — 2:30 52,248 42–25 L1
68 8:00 p.m. PDT Mets L 0–1 Jackson (3–9) Osteen (6–7) — 1:54 18,867 42–26 L2
69 8:00 p.m. PDT Mets W 4–2 Reed (2–2) Parsons (0–4) Perranoski (4) 2:18 20,633 43–26 W1
70 8:00 p.m. PDT Pirates L 3–13 Cardwell (5–2) Drysdale (11–6) — 2:33 28,867 43–27 L1
71 8:00 p.m. PDT Pirates W 4–1 Koufax (12–3) Friend (3–6) — 2:04 32,060 44–27 W1
72 1:00 p.m. PDT Pirates L 1–6 Law (8–5) Osteen (6–8) — 2:28 21,769 44–28 L1
73 1:00 p.m. PDT Pirates L 2–10 Veale (8–5) Podres (3–4) — 2:39 33,161 44–29 L2
74 8:15 p.m. PDT @ Giants L 0–5 Marichal (12–6) Drysdale (11–7) — 2:38 36,702 44–30 L3
75 1:00 p.m. PDT @ Giants W 9–3 Koufax (13–3) Shaw (7–5) — 2:45 29,380 45–30 W1
76 (1) 11:00 a.m. PDT @ Cubs L 1–4 Ellsworth (9–3) Osteen (6–9) — 2:03 — 45–31 L1
77 (2) 1:38 p.m. PDT @ Cubs W 4–3 Miller (4–2) Hoeft (0–1) — 2:38 17,950 46–31 W1
July: 15–13 (Home: 9–5; Away: 6–8)
#
Date
Time (PT)
Opponent
Score
Win
Loss
Save
Time of Game
Attendance
Record
Box/
78 11:30 a.m. PDT @ Cubs L 3–6 McDaniel (3–3) Podres (3–5) Abernathy (16) 2:34 7,420 46–32 L1
79 5:30 p.m. PDT @ Astros L 3–4 Cuellar (1–1) Drysdale (11–8) — 2:35 33,044 46–33 L2
80 5:30 p.m. PDT @ Astros W 3–1 Koufax (14–3) Dierker (2–4) — 2:10 50,136 47–33 W1
81 12:30 p.m. PDT @ Astros L 1–3 Raymond (5–3) Osteen (6–10) — 2:04 47,642 47–34 L1
82 6:05 p.m. PDT @ Reds L 4–7 Maloney (9–4) Miller (4–3) McCool (8) 2:29 29,047 47–35 L1
83 6:05 p.m. PDT @ Reds W 11–7 Drysdale (12–8) O'Toole (1–8) Perranoski (5) 2:54 18,833 48–35 W1
84 6:05 p.m. PDT @ Reds L 6–7 Nuxhall (4–2) Miller (4–4) — 2:58 25,785 48–36 L1
85 4:30 p.m. PDT @ Pirates W 9–4 Reed (3–2) Law (8–8) — 2:59 22,247 49–36 W1
86 5:15 p.m. PDT @ Pirates L 1–4 Veale (9–6) Willhite (1–1) — 2:29 16,284 49–37 L1
87 11:15 a.m. PDT @ Pirates W 8–4 Drysdale (13–8) Cardwell (8–3) Perranoski (6) 2:57 14,880 50–37 W1
88 (1) 10:00 a.m. PDT @ Pirates W 4–2 Koufax (15–3) Gibbon (2–8) — 2:29 — 51–37 W2
89 (2) 1:04 p.m. PDT @ Pirates L 3–4 (10) Carpin (3–0) Miller (4–5) — 2:42 37,631 51–38 L1
— 11:00 a.m. PDT 36th All-Star Game National League vs. American League Metropolitan Stadium Bloomington, Minnesota )
90 8:00 p.m. PDT Cubs W 5–0 Drysdale (14–8) Ellsworth (10–5) — 2:19 25,538 52–38 W1
91 8:00 p.m. PDT Cubs W 3–0 Koufax (16–3) Jackson (8–11) — 2:20 47,947 53–38 W2
92 8:00 p.m. PDT Cubs W 7–2 Osteen (7–10) Koonce (7–8) — 2:21 31,228 54–38 W3
93 1:00 p.m. PDT Cubs W 4–3 (11) Reed (4–2) Hendley (0–2) — 3:05 27,508 55–38 W4
94 8:00 p.m. PDT Astros W 8–3 Drysdale (15–8) Nottebart (1–7) — 2:34 22,756 56–38 W5
95 8:00 p.m. PDT Astros W 3–2 Koufax (17–3) Taylor (2–4) — 2:15 30,937 57–38 W6
96 8:00 p.m. PDT Braves L 4–6 Blasingame (11–7) Osteen (7–11) O'Dell (10) 3:05 28,721 57–39 L1
97 8:00 p.m. PDT Braves L 2–5 Cloninger (12–8) Miller (4–6) O'Dell (11) 2:24 27,179 57–40 L2
98 8:00 p.m. PDT Cardinals L 3–4 (12) Washburn (6–7) Willhite (1–2) — 3:48 40,286 57–41 L3
99 8:00 p.m. PDT Cardinals L 2–3 (10) Dennis (2–1) Perranoski (2–2) Woodeshick (12) 3:04 48,998 57–42 L4
100 1:00 p.m. PDT Cardinals W 5–1 Osteen (8–11) Simmons (6–10) — 2:44 31,710 58–42 W1
101 8:00 p.m. PDT Reds W 5–4 Podres (4–5) Maloney (11–5) Perranoski (7) 2:20 39,978 59–42 W2
102 8:00 p.m. PDT Reds W 9–7 Perranoski (3–2) Jay (8–3) — 3:25 46,537 60–42 W3
103 8:00 p.m. PDT Reds L 1–4 Ellis (14–6) Koufax (17–4) — 2:00 53,604 60–43 L1
104 6:00 p.m. PDT @ Cardinals W 4–2 Miller (5–6) Dennis (2–2) Perranoski (8) 2:39 29,497 61–43 W1
105 6:00 p.m. PDT @ Cardinals L 3–4 Gibson (13–8) Perranoski (3–3) — 2:31 30,109 61–44 L1
August: 14–13 (Home: 5–3; Away: 9–10)
#
Date
Time (PT)
Opponent
Score
Win
Loss
Save
Time of Game
Attendance
Record
Box/
106 11:15 a.m. PDT @ Cardinals W 3–2 Koufax (18–4) Sadecki (2–9) — 2:29 30,605 62–44 W1
107 6:00 p.m. PDT @ Cardinals L 5–6 Stallard (8–4) Perranoski (3–4) Dennis (6) 2:34 20,518 62–45 L1
— 5:30 p.m. PDT @ Braves Postponed (inclement weather); Makeup: August 4
108 (1) 4:00 p.m. PDT @ Braves L 3–4 Fischer (5–5) Drysdale (15–9) O'Dell (15) 2:44 — 62–46 L2
109 (2) 7:14 p.m. PDT @ Braves W 3–2 Osteen (9–11) Lemaster (4–9) Miller (7) 2:25 19,950 63–46 W1
110 5:30 p.m. PDT @ Braves W 6–3 Koufax (19–4) Blasingame (13–8) — 2:46 18,368 64–46 W2
111 6:05 p.m. PDT @ Reds L 4–5 (11) McCool (7–6) Perranoski (3–5) — 3:26 25,668 64–47 L1
112 5:05 p.m. PDT @ Reds W 5–3 Reed (5–2) Ellis (14–7) Perranoski (9) 2:37 27,844 65–47 W1
113 10:30 a.m. PDT @ Reds L 0–18 Maloney (13–5) Drysdale (15–10) — 2:20 28,335 65–48 L1
114 8:00 p.m. PDT Mets W 4–3 Koufax (20–4) Jackson (5–16) — 2:07 36,815 66–48 W1
115 8:00 p.m. PDT Mets W 1–0 Drysdale (16–10) Richardson (0–1) — 2:34 23,376 67–48 W2
116 8:00 p.m. PDT Pirates W 3–1 Osteen (10–11) Veale (12–9) — 2:21 32,551 68–48 W3
117 8:00 p.m. PDT Pirates W 1–0 (10) Koufax (21–4) Cardwell (10–7) — 2:43 29,237 69–48 W4
118 1:00 p.m. PDT Pirates L 2–4 Sisk (4–2) Drysdale (16–11) McBean (13) 3:02 25,175 69–49 L1
119 8:00 p.m. PDT Phillies L 1–6 Short (14–8) Podres (4–6) — 2:47 22,611 69–50 L2
120 8:00 p.m. PDT Phillies W 4–2 Osteen (11–11) Herbert (5–6) Perranoski (10) 2:31 23,144 70–50 W1
121 8:00 p.m. PDT Phillies L 3–6 (12) Wagner (5–3) Brewer (2–2) — 4:05 38,267 70–51 L1
122 8:15 p.m. PDT @ Giants W 8–5 (15) Perranoski (4–5) Perry (8–11) — 4:11 35,901 71–51 W1
123 8:15 p.m. PDT @ Giants W 5–1 Shaw (14–6) Reed (5–3) — 2:38 41,858 71–52 L1
124 1:00 p.m. PDT @ Giants W 6–4 (11) Podres (5–6) Henry (3–2) — 3:27 42,283 72–52 W1
125 1:00 p.m. PDT @ Giants L 3–4 Herbel (8–6) Koufax (21–5) Murakami (5) 2:18 42,807 72–53 L1
126 5:00 p.m. PDT @ Mets W 8–4 Drysdale (17–11) Miller (1–3) Miller (8) 2:59 33,393 73–53 W1
127 5:00 p.m. PDT @ Mets L 3–4 Eilers (1–0) Miller (5–7) — 2:34 37,023 73–54 L1
128 5:00 p.m. PDT @ Mets L 5–7 Richardson (2–1) Osteen (11–12) — 2:38 32,432 73–55 L2
129 5:00 p.m. PDT @ Mets L 2–5 McGraw (2–2) Koufax (21–6) Fisher (1) 2:24 45,950 73–56 L3
130 5:05 p.m. PDT @ Phillies W 9–8 Drysdale (18–11) Herbert (5–7) Reed (1) 3:16 26,740 74–56 W1
131 5:05 p.m. PDT @ Phillies W 8–4 Brewer (3–2) Short (14–9) Koufax (1) 3:16 27,439 75–56 W2
132 10:35 a.m. PDT @ Phillies L 3–13 Culp (9–9) Osteen (11–13) — 2:39 21,744 75–57 L1
— 5:15 p.m. PDT @ Pirates Postponed (rain); Makeup: September 1
September: 20–7 (Home: 10–3; Away: 10–4)
#
Date
Time (PT)
Opponent
Score
Win
Loss
Save
Time of Game
Attendance
Record
Box/
133 (1) 2:30 p.m. PDT @ Pirates L 2–3 (11) Gibbon (4–9) Koufax (21–7) — 3:00 — 75–58 L2
134 (2) 6:05 p.m. PDT @ Pirates L 1–2 Law (16–9) Drysdale (18–12) — 2:18 26,394 75–59 L3
135 5:15 p.m. PDT @ Pirates W 7–1 Osteen (12–13) Veale (14–10) Perranoski (11) 2:38 29,200 76–59 W1
136 5:30 p.m. PDT @ Astros W 3–0 Willhite (2–2) Nottebart (4–13) Perranoski (12) 2:14 31,154 77–59 W2
137 11:15 a.m. PDT @ Astros W 5–0 Podres (6–6) Bruce (9–17) Perranoski (13) 2:13 41,951 78–59 W3
138 12:30 p.m. PDT @ Astros W 4–2 Reed (4–2) Roberts (4–1) — 2:05 49,442 79–59 W4
139 1:00 p.m. PDT Giants L 6–7 (12) Linzy (7–2) Reed (6–4) — 3:43 53,581 79–60 L1
140 6:00 p.m. PDT Giants L 1–3 Shaw (15–8) Osteen (12–14) Murakami (7) 2:48 48,586 79–61 L2
141 8:00 p.m. PDT Cubs W 1–0 Koufax (22–7) Hendley (2–3) — 1:43 29,139 80–61 W1
142 8:00 p.m. PDT Astros W 5–2 Drysdale (19–12) Roberts (4–2) Perranoski (14) 2:00 30,200 81–61 W2
143 8:00 p.m. PDT Astros W 8–3 Osteen (13–14) Farrell (10–10) Perranoski (15) 2:32 30,278 82–61 W3
144 1:00 p.m. PDT Astros L 2–3 Owens (6–4) Perranoski (4–6) Raymond (4) 2:40 21,918 82–62 L1
145 11:30 a.m. PDT @ Cubs L 1–2 Hendley (3–3) Koufax (22–8) — 1:57 6,220 82–63 L2
146 11:30 a.m. PDT @ Cubs L 6–8 Ellsworth (14–14) Reed (6–5) Hoeft (1) 2:45 1,886 82–64 L3
147 11:30 a.m. PDT @ Cubs W 2–0 Osteen (14–14) Faul (5–5) Koufax (2) 2:15 550 83–64 W1
148 6:00 p.m. PDT @ Cardinals W 3–2 Drysdale (20–12) Simmons (9–15) Perranoski (16) 2:36 19,042 84–64 W2
149 6:00 p.m. PDT @ Cardinals W 1–0 Koufax (23–8) Washburn (9–11) — 2:11 29,063 85–64 W3
150 11:15 a.m. PDT @ Cardinals W 5–0 Osteen (15–14) Gibson (18–11) Perranoski (17) 2:33 23,941 86–64 W4
151 5:30 p.m. PDT @ Braves W 3–1 Drysdale (21–12) Lemaster (6–13) — 2:30 5,169 87–64 W5
152 6:00 p.m. PDT @ Braves W 7–6 (11) }Perranoski (5–6) Olivo (0–1) Miller (9) 3:38 12,577 88–64 W6
153 8:00 p.m. PDT Cardinals W 4–3 Perranoski (6–6) Gibson (18–12) — 2:38 37,450 89–64 W7
154 1:00 p.m. PDT Cardinals W 2–0 Koufax (24–8) Briles (2–3) — 2:10 31,532 90–64 W8
155 1:00 p.m. PDT Cardinals W 1–0 Drysdale (22–12) Sadecki (6–14) — 2:18 40,317 91–64 W9
156 8:00 p.m. PDT Reds W 6–1 Podres (7–6) Ellis (21–10) Perranoski (18) 2:31 32,593 92–64 W10
157 8:00 p.m. PDT Reds W 2–1 (12) Reed (7–5) Jay (9–8) — 3:52 38,424 93–64 W11
158 6:00 p.m. PDT Reds W 5–0 Koufax (25–8) Maloney (20–9) — 2:20 52,312 94–64 W12
159 8:00 p.m. PDT Braves W 4–0 Drysdale (23–12) Fischer (8–9) — 2:18 36,006 95–64 W13
October: 2–1 (Home: 2–1; Away: 0–0)
Detailed records
Postseason Game log
1965 Postseason game log: 4–3 (Home: 3–0; Away: 1–3)
Player stats
Note: Team batting and pitching leaders are in bold.
Batting
Starters by position
Note: Pos = Position; G = Games played; PA = Plate appearances; AB = At bats; R = Runs scored; H = Hits; 2B = Doubles hit; 3B = Triples hit; HR = Home runs; RBI = Runs batted in; SB = Stolen bases; CS = Caught stealing; BB = Walks; SO = Strikeouts; Avg. = Batting average; OBP = On-base percentage; SLG = Slugging; OPS = On Base + Slugging; TB = Total bases; GDP = Grounded into double play; HBP = Hit by pitch; SH = Sacrifice hits; SF = Sacrifice flies; IBB = Intentional base on balls
Pos
Player
G
PA
AB
R
H
2B
3B
HR
RBI
SB
CS
BB
SO
Avg.
OBP
SLG
OPS
TB
GDP
HBP
SH
SF
IBB
C
John Roseboro 136
480
437
42
102
10
0
8
57
1
6
34
51
.233
.289
.311
.601
136
5
2
3
4
7
1B
Wes Parker 154
644
542
80
129
24
7 8
51
13
7
75
95 .238
.334
.352
.687
191
6
5
19 3
1
2B
Jim Lefebvre 157
631
544
57
136
21
4
12 69
3
5
71
92
.250
.337
.369
.706
201
8 2
10
4
7
SS
Maury Wills 158 711 650 92 186 14
7 0
33
94 31 40
64
.286 .330
.329
.660
214
6
4
14
2
2
3B
Jim Gilliam 111
432
372
54
104
19
4
4
39
9
5
53
31
.280
.374
.384
.758
143
1
4
1
2
5
LF
Lou Johnson 131
518
468
57
121
24
1
12 58
15
6
24
81
.259
.315
.391 .706
183
7
16 7
3
8
CF
Willie Davis 142
595
558
52
133
24
3
10
57
25
9
14
81
.238
.263
.346
.609
193
7
7
9
7 3
RF
Ron Fairly 158 654
555
73
152
28 1
9
70 2
0
76 72
.274
.361 .377
.738 209 7
3
14
6
11
Other batters
Note: G = Games played; AB = At bats; H = Hits; Avg. = Batting average; HR = Home runs; RBI = Runs batted in
Pitching
= Indicates league leader
Starting pitchers
Note: G = Games pitched; IP = Innings pitched; W = Wins; L = Losses; ERA = Earned run average; SO = Strikeouts
Other pitchers
Note: G = Games pitched; IP = Innings pitched; W = Wins; L = Losses; ERA = Earned run average; SO = Strikeouts
Relief pitchers
Note: G = Games pitched; W = Wins; L = Losses; SV = Saves; ERA = Earned run average; SO = Strikeouts
1965 World Series
Game 1
October 6, 1965, at Metropolitan Stadium in Bloomington, Minnesota
Game 2
October 7, 1965, at Metropolitan Stadium in Bloomington, Minnesota
Team
1
2
3
4
5
6
7
8
9
R
H
E
Los Angeles (N)
0
0
0
0
0
0
1
0
0
1 7 3
Minnesota (A)
0
0
0
0
0
2
1
2
x
5 9 0
W : Jim Kaat (1–0) L : Sandy Koufax (0–1)
Game 3
October 9, 1965, at Dodger Stadium in Los Angeles
Team
1
2
3
4
5
6
7
8
9
R
H
E
Minnesota (A)
0
0
0
0
0
0
0
0
0
0 5 0
Los Angeles (N)
0
0
0
2
1
1
0
0
x
4 10 1
W : Claude Osteen (1–0) L : Camilo Pascual (0–1)
Game 4
October 10, 1965, at Dodger Stadium in Los Angeles
Game 5
October 11, 1965, at Dodger Stadium in Los Angeles
Team
1
2
3
4
5
6
7
8
9
R
H
E
Minnesota (A)
0
0
0
0
0
0
0
0
0
0 4 1
Los Angeles (N)
2
0
2
1
0
0
2
0
x
7 14 0
W : Sandy Koufax (1–1) L : Jim Kaat (1–1)
Game 6
October 13, 1965, at Metropolitan Stadium in Bloomington, Minnesota
Game 7
October 14, 1965, at Metropolitan Stadium in Bloomington, Minnesota
Team
1
2
3
4
5
6
7
8
9
R
H
E
Los Angeles (N)
0
0
0
2
0
0
0
0
0
2 7 0
Minnesota (A)
0
0
0
0
0
0
0
0
0
0 3 1
W : Sandy Koufax (2–1) L : Jim Kaat (1–2)
HR : LAD – Lou Johnson (2)
Awards and honors
Hall of Famer Sandy Koufax
All-Stars
Farm system
LEAGUE CHAMPIONS: Albuquerque
This was the first Major League Baseball draft . The Dodgers drafted 30 players this year in the June draft and an additional 2 in the August Legion draft. The first player the Dodgers ever drafted was a shortstop from Bakersfield High School named John Wyatt. He played in the teams farm system through 1970 but never advanced past Class-A.
The most notable player drafted this year was Tom Seaver , who was picked in the 10th round from the University of Southern California, but he did not sign with the team and re-entered the draft the following year, where he was selected by the New York Mets .
1965 draft picks
June draft
[ 8]
Round
Name
Position
School
Signed
Career span
Highest level
1
John Wyatt
SS
Bakersfield High School
Yes
1965–1970
A
2
Alan Foster
RHP
Los Altos High School
Yes
1965–1976
MLB
3
Michael Criscione
C
Syracuse University
Yes
1965–1967
A
4
George Mercado
OF
Bishop Dubois High School
Yes
1965–1967
A-
5
John Radosevich
LHP
West Virginia University
Yes
1965–1968
A
6
Peter Barnes
OF
Southern University and A&M College
No
7
Larry Griffith
RHP
Anadarko High School
Yes
1965–1967
AA
8
James Johnson
OF
Las Vegas High School
Yes
1965–1970
A
9
Paul Dennenbaum
1B
Syracuse University
No
10
Tom Seaver
RHP
University of Southern California
No Mets −1966
1966–1986
MLB
11
Joseph Austin
1B
University of Southern California
Yes
1965–1966
A
12
Richard Binder
LHP
Waterloo High School
No
13
Terrance Derringer
RHP
Southwest Miami High School
No
14
Stephen McGreevy
1B
University of Kansas
Yes
1965–1967
A
15
Leon Everitt
RHP
Pemberton High School
Yes
1965–1969
MLB
16
Michael McCall
SS
Greenville High School
NoRed Sox −1965
1967–1970
A
17
Johnny Alexander
INF
Whitmire High School
No
18
Rod Austin
OF
Santa Clara University
No
19
George Lewark
SS
University of Colorado
No
20
William Maxwell
RHP
Central High School
No
21
Daro Quiring
RHP
Stanford University
No
22
Eric Krumlauf
3B
Shaker Heights High School
No
23
Rich Hinton
LHP
Marana High School
NoWhite Sox −1969
1969–1979
MLB
24
Frederick Moulder
SS
Oklahoma State University
Yes
1967–1972
AAA
25
Jon Keirns
OF
Edmond High School
No
26
Robert Harvey
3B
John Marshall High School
Yes
1966–1968
A
27
Rhett Thompson
3B
Del Mar High School
Yes
1965–1967
A-
28
Gary Moore
OF
University of Texas at Austin
Yes
1967–1971
MLB
29
Kyle Carlin
RHP
Sulphur High School
Yes
1965–1969
AA
30
Dennis Jensen
SS
Jacksonville University
Yes
1965
A
August Legion draft
[ 9]
Round
Name
Position
School
Signed
Career span
Highest level
1
Barry Snyder
C
No
2
Frank Stanek
1B
No
Notes
References
External links
Established in 1884
Formerly the Brooklyn Robins and the Brooklyn Dodgers
Based in Los Angeles, California Franchise Ballparks Culture
Lore Rivalries Key personnel World Series League pennants Division titles (23) Wild card berths (3) Minor league affiliates
Seasons (142)
1880s 1890s 1900s 1910s 1920s 1930s 1940s 1950s 1960s 1970s 1980s 1990s 2000s 2010s 2020s
American League National League