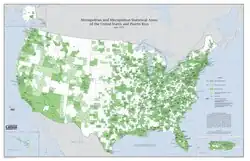
Metropolitan statistical area
| Population tables of U.S. cities |
|---|
.jpg) |
| Cities |
Population
|
| Urban areas |
| Populous cities and metropolitan areas |
| Metropolitan areas |
|
| Megaregions |
|
In the United States, a metropolitan statistical area (MSA) is a geographical region with a relatively high population density at its core and close economic ties throughout the region.[1][2] Such regions are not legally incorporated as a city or town would be and are not legal administrative divisions like counties or separate entities such as states. As a result, sometimes the precise definition of a given metropolitan area will vary between sources. The statistical criteria for a standard metropolitan area were defined in 1949 and redefined as a metropolitan statistical area in 1983.[3]
Due to suburbanization, the typical metropolitan area is polycentric rather than being centered around a large historic core city such as New York City or Chicago.[4] Some metropolitan areas include more than one large historic core city; examples include the Dallas–Fort Worth metroplex, Virginia Beach–Norfolk–Newport News (Hampton Roads), Riverside–San Bernardino (Inland Empire), and Minneapolis–Saint Paul (Twin Cities).
MSAs are defined by the Office of Management and Budget (OMB), which is part of the Executive Office of the President, and are used by the U.S. Census Bureau and other U.S. federal government agencies for statistical purposes.[5]
Definitions

The U.S. Office of Management and Budget defines a set of core-based statistical areas (CBSAs) throughout the country, which are composed of counties and county equivalents.[7]
CBSAs are delineated on the basis of a central contiguous area of relatively high population density, known as an urban area. The counties containing the core urban area are known as the "central counties" of the CBSA; these are defined as having at least 50% of their population living in urban areas of at least 10,000 in population.[8] Additional surrounding counties, known as "outlying counties", can be included in the CBSA if these counties have strong social and economic ties to the central county or counties as measured by commuting and employment. Outlying counties are included in the CBSA if 25% of the workers living in the county work in the central county or counties, or if 25% of the employment in the county is held by workers who live in the central county or counties.
Adjacent CBSAs are merged into a single CBSA when the central county or counties of one CBSA qualify as an outlying county or counties to the other CBSAs.[8] One or more CBSAs may be grouped together or combined to form a larger statistical entity known as a combined statistical area (CSA) when the employment interchange measure (EIM) reaches 15% or more.
CBSAs are subdivided into MSAs (formed around urban areas of at least 50,000 in population) and micropolitan statistical areas (μSAs), which are CBSAs built around an urban area of at least 10,000 in population but less than 50,000 in population. Some metropolitan areas may include multiple cities below 50,000 people, but combined have over 50,000 people.[8] Previous terms that are no longer used to describe these regions include "standard metropolitan statistical area" (SMSA) and "primary metropolitan statistical area" (PMSA).[9] Metropolitan statistical areas containing over 2.5 million people can also be further divided into metropolitan divisions.[10]
On January 19, 2021, OMB submitted a regulation for public comment that would increase the minimum population needed for an urban area population to be a metropolitan statistical area to be increased from 50,000 to 100,000.[11] It ultimately decided to keep the minimum at 50,000 for the 2020 cycle.[12]
On July 21, 2023, the Office of Management and Budget released revised delineations of the various CBSAs in the United States.[6]
History
The Census Bureau created the metropolitan district for the 1910 census as a standardized classification for large urban centers and their surrounding areas. The original threshold for a metropolitan district was 200,000, but was lowered to 100,000 in 1930 and 50,000 in 1940.[13] The metropolitan districts were replaced by standard metropolitan areas (SMAs) in the 1950 census, which were defined by the Bureau of the Budget (now the Office of Management and Budget) and later renamed to standard metropolitan statistical areas (SMAs) in 1959.[13][14] The modern metropolitan statistical area was created in 1983 amid a large increase in the number of eligible markets, which grew from 172 in 1950 to 288 in 1980;[13][15] the core based statistical area (CBSA) was introduced in 2000 and defined in 2003 with a minimum population of 10,000 required for micropolitan areas and 50,000 for urban areas.[13][14]
United States
The 387 MSAs in the United States, including those in all 50 states and the national capital of Washington, D.C. are ranked, including:
- The MSA rank by population as of July 1, 2024, as estimated by the United States Census Bureau[16]
- The MSA name as designated by the United States Office of Management and Budget[6]
- The MSA population as of July 1, 2024, as estimated by the United States Census Bureau[16]
- The MSA population as of April 1, 2020, as enumerated by the 2020 United States census[16][a]
- The percent MSA population change from April 1, 2020, to July 1, 2024[16]
- The combined statistical area (CSA)[b] if it is designated and the MSA is a component[17]
| Metropolitan statistical area | 2024 estimate |
2020 census[a] |
% change |
Encompassing combined statistical area |
|---|---|---|---|---|
| New York–Newark–Jersey City, NY-NJ MSA | 19,940,274 | 20,081,935 | −0.71% | New York–Newark, NY-NJ-CT-PA CSA |
| Los Angeles–Long Beach–Anaheim, CA MSA | 12,927,614 | 13,200,998 | −2.07% | Los Angeles–Long Beach, CA CSA |
| Chicago–Naperville–Elgin, IL-IN MSA | 9,408,576 | 9,449,351 | −0.43% | Chicago–Naperville, IL-IN-WI CSA |
| Dallas–Fort Worth–Arlington, TX MSA | 8,344,032 | 7,637,387 | +9.25% | Dallas–Fort Worth, TX-OK CSA |
| Houston–Pasadena–The Woodlands, TX MSA | 7,796,182 | 7,149,642 | +9.04% | Houston–Pasadena, TX CSA |
| Miami–Fort Lauderdale–West Palm Beach, FL MSA | 6,457,988 | 6,138,333 | +5.21% | Miami–Port St. Lucie–Fort Lauderdale, FL CSA |
| Washington–Arlington–Alexandria, DC-VA-MD-WV MSA | 6,436,489 | 6,278,542 | +2.52% | Washington–Baltimore–Arlington, DC-MD-VA-WV-PA CSA |
| Atlanta–Sandy Springs–Roswell, GA MSA | 6,411,149 | 6,104,803 | +5.02% | Atlanta–Athens-Clarke County–Sandy Springs, GA-AL CSA |
| Philadelphia–Camden–Wilmington, PA-NJ-DE-MD MSA | 6,330,422 | 6,245,051 | +1.37% | Philadelphia–Reading–Camden, PA-NJ-DE-MD CSA |
| Phoenix–Mesa–Chandler, AZ MSA | 5,186,958 | 4,845,832 | +7.04% | Phoenix–Mesa, AZ CSA |
| Boston–Cambridge–Newton, MA-NH MSA | 5,025,517 | 4,941,632 | +1.70% | Boston–Worcester–Providence, MA-RI-NH CSA |
| Riverside–San Bernardino–Ontario, CA MSA | 4,744,214 | 4,599,839 | +3.14% | Los Angeles–Long Beach, CA CSA |
| San Francisco–Oakland–Fremont, CA MSA | 4,648,486 | 4,749,008 | −2.12% | San Jose–San Francisco–Oakland, CA CSA |
| Detroit–Warren–Dearborn, MI MSA | 4,400,578 | 4,392,041 | +0.19% | Detroit–Warren–Ann Arbor, MI CSA |
| Seattle–Tacoma–Bellevue, WA MSA | 4,145,494 | 4,018,762 | +3.15% | Seattle–Tacoma, WA CSA |
| Minneapolis–St. Paul–Bloomington, MN-WI MSA | 3,757,952 | 3,690,261 | +1.83% | Minneapolis–St. Paul, MN-WI CSA |
| Tampa–St. Petersburg–Clearwater, FL MSA | 3,424,560 | 3,175,275 | +7.85% | |
| San Diego–Chula Vista–Carlsbad, CA MSA | 3,298,799 | 3,298,634 | +0.01% | |
| Denver–Aurora–Centennial, CO MSA | 3,052,498 | 2,963,821 | +2.99% | Denver–Aurora–Greeley, CO CSA |
| Orlando–Kissimmee–Sanford, FL MSA | 2,940,513 | 2,673,376 | +9.99% | Orlando–Lakeland–Deltona, FL CSA |
| Charlotte–Concord–Gastonia, NC-SC MSA | 2,883,370 | 2,660,329 | +8.38% | Charlotte–Concord, NC-SC CSA |
| Baltimore–Columbia–Towson, MD MSA | 2,859,024 | 2,844,510 | +0.51% | Washington–Baltimore–Arlington, DC-MD-VA-WV-PA CSA |
| St. Louis, MO-IL MSA | 2,811,927 | 2,820,253 | −0.30% | St. Louis–St. Charles–Farmington, MO-IL CSA |
| San Antonio–New Braunfels, TX MSA | 2,763,006 | 2,558,143 | +8.01% | San Antonio–New Braunfels–Kerrville, TX CSA |
| Austin–Round Rock–San Marcos, TX MSA | 2,550,637 | 2,283,371 | +11.70% | |
| Portland–Vancouver–Hillsboro, OR-WA MSA | 2,537,904 | 2,512,859 | +1.00% | Portland–Vancouver–Salem, OR-WA CSA |
| Sacramento–Roseville–Folsom, CA MSA | 2,463,127 | 2,397,382 | +2.74% | Sacramento–Roseville, CA CSA |
| Pittsburgh, PA MSA | 2,429,917 | 2,457,000 | −1.10% | Pittsburgh–Weirton–Steubenville, PA-OH-WV CSA |
| Las Vegas–Henderson–North Las Vegas, NV MSA | 2,398,871 | 2,265,461 | +5.89% | Las Vegas–Henderson, NV CSA |
| Cincinnati, OH-KY-IN MSA | 2,302,815 | 2,249,797 | +2.36% | Cincinnati–Wilmington, OH-KY-IN CSA |
| Kansas City, MO-KS MSA | 2,253,579 | 2,192,035 | +2.81% | Kansas City–Overland Park–Kansas City, MO-KS CSA |
| Columbus, OH MSA | 2,225,377 | 2,138,926 | +4.04% | Columbus–Marion–Zanesville, OH CSA |
| Indianapolis–Carmel–Greenwood, IN MSA | 2,174,833 | 2,089,653 | +4.08% | Indianapolis–Carmel–Muncie, IN CSA |
| Cleveland, OH MSA | 2,171,877 | 2,185,825 | −0.64% | Cleveland–Akron–Canton, OH CSA |
| Nashville-Davidson–Murfreesboro–Franklin, TN MSA | 2,150,553 | 2,014,444 | +6.76% | Nashville-Davidson–Murfreesboro, TN CSA |
| San Jose–Sunnyvale–Santa Clara, CA MSA | 1,995,484 | 2,000,468 | −0.25% | San Jose–San Francisco–Oakland, CA CSA |
| Virginia Beach–Norfolk–Newport News, VA–NC, MSA | 1,794,278 | 1,780,059 | +0.80% | Virginia Beach–Norfolk, VA-NC CSA |
| Jacksonville, FL MSA | 1,760,548 | 1,605,848 | +9.63% | Jacksonville–Kingsland–Palatka, FL-GA CSA |
| Providence–Warwick, RI-MA MSA | 1,700,901 | 1,676,579 | +1.45% | Boston–Worcester–Providence, MA-RI-NH CSA |
| Milwaukee–Waukesha, WI MSA | 1,574,452 | 1,574,731 | −0.02% | Milwaukee–Racine–Waukesha, WI CSA |
| Raleigh–Cary, NC MSA | 1,562,009 | 1,413,982 | +10.47% | Raleigh–Durham–Cary, NC CSA |
| Oklahoma City, OK MSA | 1,497,821 | 1,425,695 | +5.06% | Oklahoma City–Shawnee, OK CSA |
| Louisville/Jefferson County, KY-IN MSA | 1,394,234 | 1,362,180 | +2.35% | Louisville/Jefferson County–Elizabethtown, KY-IN CSA |
| Richmond, VA MSA | 1,370,165 | 1,314,434 | +4.24% | |
| Memphis, TN-MS-AR MSA | 1,339,345 | 1,345,425 | −0.45% | Memphis–Clarksdale–Forrest City, TN-MS-AR CSA |
| Salt Lake City–Murray, UT MSA | 1,300,762 | 1,257,936 | +3.40% | Salt Lake City–Provo–Orem, UT CSA |
| Birmingham, AL MSA | 1,192,583 | 1,180,631 | +1.01% | Birmingham–Cullman–Talladega, AL CSA |
| Fresno, CA MSA | 1,189,557 | 1,164,909 | +2.12% | Fresno–Hanford–Corcoran, CA CSA |
| Grand Rapids–Wyoming–Kentwood, MI MSA | 1,178,826 | 1,150,015 | +2.51% | Grand Rapids–Wyoming, MI CSA |
| Hartford–West Hartford–East Hartford, CT MSA | 1,169,048 | 1,150,473 | +1.61% | New Haven–Hartford–Waterbury, CT CSA |
| Buffalo–Cheektowaga, NY MSA | 1,160,172 | 1,166,902 | −0.58% | Buffalo–Cheektowaga–Olean, NY CSA |
| Tucson, AZ MSA | 1,080,149 | 1,043,433 | +3.52% | Tucson–Nogales, AZ CSA |
| Tulsa, OK MSA | 1,059,803 | 1,015,331 | +4.38% | Tulsa–Bartlesville–Muskogee, OK CSA |
| Rochester, NY MSA | 1,057,218 | 1,065,361 | −0.76% | Rochester–Batavia–Seneca Falls, NY CSA |
| Omaha, NE-IA MSA | 1,001,010 | 967,604 | +3.45% | Omaha–Fremont, NE-IA CSA |
| Urban Honolulu, HI MSA | 998,747 | 1,016,508 | −1.75% | |
| Greenville–Anderson–Greer, SC MSA | 996,680 | 928,195 | +7.38% | Greenville–Spartanburg–Anderson, SC CSA |
| Bridgeport–Stamford–Danbury, CT MSA | 972,679 | 946,327 | +2.78% | New York–Newark, NY-NJ-CT-PA CSA |
| New Orleans–Metairie, LA MSA | 966,230 | 1,007,275 | −4.07% | New Orleans–Metairie–Slidell, LA-MS CSA |
| Knoxville, TN MSA | 957,608 | 903,300 | +6.01% | Knoxville–Morristown–Sevierville, TN CSA |
| North Port–Bradenton–Sarasota, FL MSA | 934,956 | 833,716 | +12.14% | North Port–Bradenton, FL CSA |
| Albuquerque, NM MSA | 926,303 | 916,528 | +1.07% | Albuquerque–Santa Fe–Los Alamos, NM CSA |
| Bakersfield–Delano, CA MSA | 922,529 | 909,235 | +1.46% | |
| McAllen–Edinburg–Mission, TX MSA | 914,820 | 870,781 | +5.06% | McAllen–Edinburg, TX CSA |
| Albany–Schenectady–Troy, NY MSA | 913,485 | 899,262 | +1.58% | Albany–Schenectady, NY CSA |
| Allentown–Bethlehem–Easton, PA-NJ MSA | 886,418 | 861,889 | +2.85% | Allentown–Bethlehem–East Stroudsburg, PA-NJ CSA |
| Baton Rouge, LA MSA | 882,652 | 870,569 | +1.39% | Baton Rouge–Hammond, LA CSA |
| Worcester, MA MSA | 881,248 | 862,111 | +2.22% | Boston–Worcester–Providence, MA-RI-NH CSA |
| El Paso, TX MSA | 879,392 | 868,859 | +1.21% | El Paso–Las Cruces, TX-NM CSA |
| Columbia, SC MSA | 870,193 | 829,470 | +4.91% | Columbia–Sumter–Orangeburg, SC CSA |
| Charleston–North Charleston, SC MSA | 869,940 | 799,636 | +8.79% | |
| Cape Coral–Fort Myers, FL MSA | 860,959 | 760,822 | +13.16% | Cape Coral–Fort Myers–Naples, FL CSA |
| Lakeland–Winter Haven, FL MSA | 852,878 | 725,046 | +17.63% | Orlando–Lakeland–Deltona, FL CSA |
| Boise City, ID MSA | 845,877 | 764,718 | +10.61% | Boise City–Mountain Home–Ontario, ID-OR CSA |
| Oxnard–Thousand Oaks–Ventura, CA MSA | 835,427 | 843,843 | −1.00% | Los Angeles–Long Beach, CA CSA |
| Dayton–Kettering–Beavercreek, OH MSA | 821,740 | 814,049 | +0.94% | Dayton–Springfield–Kettering, OH CSA |
| Stockton–Lodi, CA MSA | 816,108 | 779,233 | +4.73% | San Jose–San Francisco–Oakland, CA CSA |
| Greensboro–High Point, NC MSA | 800,722 | 776,566 | +3.11% | Greensboro–Winston-Salem–High Point, NC CSA |
| Colorado Springs, CO MSA | 777,634 | 755,105 | +2.98% | |
| Little Rock–North Little Rock–Conway, AR MSA | 769,258 | 748,031 | +2.84% | Little Rock–North Little Rock, AR CSA |
| Provo–Orem–Lehi, UT MSA | 760,531 | 671,185 | +13.31% | Salt Lake City–Provo–Orem, UT CSA |
| Des Moines–West Des Moines, IA MSA | 753,913 | 709,466 | +6.26% | Des Moines–West Des Moines–Ames, IA CSA |
| Deltona–Daytona Beach–Ormond Beach, FL MSA | 739,516 | 668,921 | +10.55% | Orlando–Lakeland–Deltona, FL CSA |
| Kiryas Joel–Poughkeepsie–Newburgh, NY MSA | 711,730 | 697,221 | +2.08% | New York–Newark, NY-NJ-CT-PA CSA |
| Madison, WI MSA | 707,606 | 680,796 | +3.94% | Madison–Janesville–Beloit, WI CSA |
| Winston-Salem, NC MSA | 705,187 | 675,966 | +4.32% | Greensboro–Winston-Salem–High Point, NC CSA |
| Akron, OH MSA | 702,209 | 702,219 | 0.00% | Cleveland–Akron–Canton, OH CSA |
| Ogden, UT MSA | 667,681 | 637,197 | +4.78% | Salt Lake City–Provo–Orem, UT CSA |
| Wichita, KS MSA | 661,217 | 647,610 | +2.10% | Wichita–Arkansas City–Winfield, KS CSA |
| Palm Bay–Melbourne–Titusville, FL MSA | 658,447 | 606,612 | +8.55% | |
| Syracuse, NY MSA | 655,189 | 662,057 | −1.04% | Syracuse–Auburn, NY CSA |
| Augusta-Richmond County, GA-SC MSA | 636,760 | 611,000 | +4.22% | |
| Durham–Chapel Hill, NC MSA | 620,522 | 588,911 | +5.37% | Raleigh–Durham–Cary, NC CSA |
| Harrisburg–Carlisle, PA MSA | 615,361 | 591,712 | +4.00% | Harrisburg–York–Lebanon, PA CSA |
| Jackson, MS MSA | 606,178 | 619,968 | −2.22% | Jackson–Vicksburg–Brookhaven, MS CSA |
| Fayetteville–Springdale–Rogers, AR MSA | 605,615 | 546,725 | +10.77% | |
| Spokane–Spokane Valley, WA MSA | 604,962 | 585,784 | +3.27% | Spokane–Spokane Valley–Coeur d'Alene, WA-ID CSA |
| Toledo, OH MSA | 601,396 | 606,240 | −0.80% | |
| Chattanooga, TN-GA MSA | 588,050 | 562,647 | +4.51% | Chattanooga–Cleveland–Dalton, TN-GA-AL CSA |
| New Haven, CT MSA | 576,718 | 570,487 | +1.09% | New Haven–Hartford–Waterbury, CT CSA |
| Reno, NV MSA | 575,110 | 549,831 | +4.60% | Reno–Carson City–Gardnerville Ranchos, NV-CA CSA |
| Scranton–Wilkes-Barre, PA MSA | 574,009 | 567,559 | +1.14% | |
| Portland–South Portland, ME MSA | 571,534 | 551,740 | +3.59% | Portland–Lewiston–South Portland, ME CSA |
| Lancaster, PA MSA | 563,293 | 552,984 | +1.86% | |
| Modesto, CA MSA | 556,972 | 552,878 | +0.74% | San Jose–San Francisco–Oakland, CA CSA |
| Port St. Lucie, FL MSA | 556,336 | 487,657 | +14.08% | Miami–Port St. Lucie–Fort Lauderdale, FL CSA |
| Huntsville, AL MSA | 542,297 | 491,723 | +10.29% | Huntsville–Decatur–Albertville, AL-TN CSA |
| Pensacola–Ferry Pass–Brent, FL MSA | 538,928 | 509,905 | +5.69% | |
| Lexington-Fayette, KY MSA | 533,366 | 516,811 | +3.20% | Lexington-Fayette–Richmond–Frankfort, KY CSA |
| Killeen–Temple, TX MSA | 509,487 | 475,367 | +7.18% | |
| Springfield, MO MSA | 496,975 | 475,432 | +4.53% | |
| Santa Rosa–Petaluma, CA MSA | 485,375 | 488,863 | −0.71% | |
| Visalia, CA MSA | 483,546 | 473,117 | +2.20% | |
| Wilmington, NC MSA | 480,522 | 422,598 | +13.71% | |
| Lansing–East Lansing, MI MSA | 479,971 | 473,203 | +1.43% | Lansing–East Lansing–Owosso, MI CSA |
| York–Hanover, PA MSA | 471,240 | 456,438 | +3.24% | Harrisburg–York–Lebanon, PA CSA |
| Springfield, MA MSA | 464,151 | 465,825 | −0.36% | Springfield–Amherst Town–Northampton, MA CSA |
| Fort Wayne, IN MSA | 462,978 | 447,781 | +3.39% | Fort Wayne–Huntington–Auburn, IN CSA |
| Waterbury–Shelton, CT MSA | 462,220 | 450,376 | +2.63% | New Haven–Hartford–Waterbury, CT CSA |
| Vallejo, CA MSA | 455,101 | 453,491 | +0.36% | San Jose–San Francisco–Oakland, CA CSA |
| Corpus Christi, TX MSA | 450,187 | 445,763 | +0.99% | Corpus Christi–Kingsville–Alice, TX CSA |
| Santa Maria–Santa Barbara, CA MSA | 444,500 | 448,229 | −0.83% | |
| Salem, OR MSA | 443,416 | 433,353 | +2.32% | Portland–Vancouver–Salem, OR-WA CSA |
| Reading, PA MSA | 439,117 | 428,849 | +2.39% | Philadelphia–Reading–Camden, PA-NJ-DE-MD CSA |
| Salinas, CA MSA | 436,251 | 439,035 | −0.63% | |
| Brownsville–Harlingen, TX MSA | 431,874 | 421,017 | +2.58% | Brownsville–Harlingen–Raymondville, TX CSA |
| Savannah, GA MSA | 431,589 | 404,798 | +6.62% | Savannah–Hinesville–Statesboro, GA CSA |
| Manchester–Nashua, NH MSA | 430,462 | 422,937 | +1.78% | Boston–Worcester–Providence, MA-RI-NH CSA |
| Ocala, FL MSA | 428,905 | 375,908 | +14.10% | |
| Gulfport–Biloxi, MS MSA | 426,793 | 416,259 | +2.53% | |
| Youngstown–Warren, OH MSA | 426,086 | 430,591 | −1.05% | Youngstown–Warren–Salem, OH CSA |
| Asheville, NC MSA | 422,333 | 406,926 | +3.79% | Asheville–Waynesville–Brevard, NC CSA |
| Lafayette, LA MSA | 419,704 | 408,455 | +2.75% | Lafayette–New Iberia–Opelousas, LA CSA |
| Naples–Marco Island, FL MSA | 416,233 | 375,752 | +10.77% | Cape Coral–Fort Myers–Naples, FL CSA |
| Myrtle Beach–Conway–North Myrtle Beach, SC MSA | 413,391 | 351,029 | +17.77% | Myrtle Beach–Conway, SC CSA |
| Mobile, AL MSA | 412,339 | 414,809 | −0.60% | Mobile–Daphne–Fairhope, AL CSA |
| Anchorage, AK MSA | 407,213 | 398,328 | +2.23% | |
| Flint, MI MSA | 402,279 | 406,211 | −0.97% | Detroit–Warren–Ann Arbor, MI CSA |
| Canton–Massillon, OH MSA | 400,551 | 401,574 | −0.25% | Cleveland–Akron–Canton, OH CSA |
| Beaumont–Port Arthur, TX MSA | 398,733 | 397,565 | +0.29% | |
| Tallahassee, FL MSA | 397,675 | 384,298 | +3.48% | Tallahassee–Bainbridge, FL-GA CSA |
| Spartanburg, SC MSA | 395,934 | 355,241 | +11.46% | Greenville–Spartanburg–Anderson, SC CSA |
| Fayetteville, NC MSA | 393,812 | 386,810 | +1.81% | Fayetteville–Lumberton–Pinehurst, NC CSA |
| Trenton–Princeton, NJ MSA | 392,138 | 387,340 | +1.24% | New York–Newark, NY-NJ-CT-PA CSA |
| Montgomery, AL MSA | 387,885 | 386,047 | +0.48% | Montgomery–Selma, AL CSA |
| Shreveport–Bossier City, LA MSA | 383,269 | 393,406 | −2.58% | Shreveport–Bossier City–Minden, LA CSA |
| Eugene–Springfield, OR MSA | 382,396 | 382,971 | −0.15% | |
| Davenport–Moline–Rock Island, IA-IL MSA | 381,801 | 384,324 | −0.66% | Davenport–Moline, IA-IL CSA |
| Fort Collins–Loveland, CO MSA | 374,574 | 359,066 | +4.32% | |
| Ann Arbor, MI MSA | 373,875 | 372,258 | +0.43% | Detroit–Warren–Ann Arbor, MI CSA |
| Hickory–Lenoir–Morganton, NC MSA | 373,031 | 365,276 | +2.12% | Charlotte–Concord, NC-SC CSA |
| Atlantic City–Hammonton, NJ MSA | 372,989 | 369,797 | +0.86% | Philadelphia–Reading–Camden, PA-NJ-DE-MD CSA |
| Greeley, CO MSA | 369,745 | 328,981 | +12.39% | Denver–Aurora–Greeley, CO CSA |
| Lubbock, TX MSA | 367,109 | 351,268 | +4.51% | Lubbock–Plainview, TX CSA |
| Huntington–Ashland, WV-KY-OH MSA | 366,920 | 376,155 | −2.46% | Charleston–Huntington–Ashland, WV-OH-KY CSA |
| Peoria, IL MSA | 364,565 | 368,782 | −1.14% | Peoria–Canton, IL CSA |
| Gainesville, FL MSA | 359,780 | 339,247 | +6.05% | Gainesville–Lake City, FL CSA |
| Lincoln, NE MSA | 350,626 | 340,217 | +3.06% | Lincoln–Beatrice, NE CSA |
| Clarksville, TN-KY MSA | 345,955 | 320,535 | +7.93% | |
| Rockford, IL MSA | 337,103 | 338,798 | −0.50% | Rockford–Freeport–Rochelle, IL CSA |
| Green Bay, WI MSA | 334,697 | 328,268 | +1.96% | Green Bay–Shawano, WI CSA |
| Boulder, CO MSA | 330,262 | 330,758 | −0.15% | Denver–Aurora–Greeley, CO CSA |
| South Bend–Mishawaka, IN-MI MSA | 325,294 | 324,501 | +0.24% | South Bend–Elkhart–Mishawaka, IN-MI CSA |
| Columbus, GA-AL MSA | 324,343 | 328,883 | −1.38% | Columbus–Auburn–Opelika, GA-AL CSA |
| Kennewick–Richland, WA MSA | 319,428 | 303,622 | +5.21% | Kennewick–Richland–Walla Walla, WA CSA |
| Roanoke, VA MSA | 315,749 | 315,251 | +0.16% | |
| Kingsport–Bristol, TN-VA MSA | 313,876 | 307,614 | +2.04% | Johnson City–Kingsport–Bristol, TN-VA CSA |
| Hagerstown–Martinsburg, MD-WV MSA | 311,295 | 293,844 | +5.94% | Washington–Baltimore–Arlington, DC-MD-VA-WV-PA CSA |
| Crestview–Fort Walton Beach–Destin, FL MSA | 310,149 | 286,973 | +8.08% | |
| Sioux Falls, SD-MN MSA | 308,266 | 286,434 | +7.62% | |
| Waco, TX MSA | 307,123 | 295,782 | +3.83% | |
| Olympia–Lacey–Tumwater, WA MSA | 302,912 | 294,793 | +2.75% | Seattle–Tacoma, WA CSA |
| Merced, CA MSA | 296,774 | 281,202 | +5.54% | San Jose–San Francisco–Oakland, CA CSA |
| Longview, TX MSA | 295,490 | 286,184 | +3.25% | |
| Utica–Rome, NY MSA | 287,932 | 292,264 | −1.48% | |
| College Station–Bryan, TX MSA | 287,462 | 268,248 | +7.16% | |
| Norwich–New London–Willimantic, CT MSA | 282,602 | 280,430 | +0.77% | New Haven–Hartford–Waterbury, CT CSA |
| Tuscaloosa, AL MSA | 281,963 | 268,674 | +4.95% | |
| San Luis Obispo–Paso Robles, CA MSA | 281,843 | 282,424 | −0.21% | |
| Duluth, MN-WI MSA | 281,815 | 280,733 | +0.39% | Duluth–Grand Rapids, MN-WI CSA |
| Bremerton–Silverdale–Port Orchard, WA MSA | 281,420 | 275,611 | +2.11% | Seattle–Tacoma, WA CSA |
| Cedar Rapids, IA MSA | 278,677 | 276,520 | +0.78% | Cedar Rapids–Iowa City, IA CSA |
| Slidell–Mandeville–Covington, LA MSA | 277,615 | 264,570 | +4.93% | New Orleans–Metairie–Slidell, LA-MS CSA |
| Amarillo, TX MSA | 274,650 | 268,691 | +2.22% | Amarillo–Borger, TX CSA |
| Laredo, TX MSA | 272,823 | 267,114 | +2.14% | |
| Evansville, IN MSA | 271,793 | 269,256 | +0.94% | Evansville–Henderson, IN-KY CSA |
| Fargo, ND-MN MSA | 267,793 | 249,843 | +7.18% | Fargo–Wahpeton, ND-MN CSA |
| Erie, PA MSA | 267,750 | 270,876 | −1.15% | Erie–Meadville, PA CSA |
| Lynchburg, VA MSA | 266,432 | 261,593 | +1.85% | |
| Kalamazoo–Portage, MI MSA | 264,780 | 261,670 | +1.19% | Kalamazoo–Battle Creek–Portage, MI CSA |
| Bend, OR MSA | 264,407 | 247,493 | +6.83% | |
| Santa Cruz–Watsonville, CA MSA | 262,406 | 270,861 | −3.12% | San Jose–San Francisco–Oakland, CA CSA |
| Daphne–Fairhope–Foley, AL MSA | 261,608 | 231,767 | +12.88% | Mobile–Daphne–Fairhope, AL CSA |
| Yakima, WA MSA | 258,523 | 256,728 | +0.70% | |
| Prescott Valley–Prescott, AZ MSA | 252,013 | 236,209 | +6.69% | |
| Tyler, TX MSA | 249,091 | 233,479 | +6.69% | Tyler–Jacksonville, TX CSA |
| Appleton, WI MSA | 248,992 | 243,147 | +2.40% | Appleton–Oshkosh–Neenah, WI CSA |
| Binghamton, NY MSA | 243,971 | 247,138 | −1.28% | |
| Lake Charles, LA MSA | 242,975 | 254,652 | −4.59% | Lake Charles–DeRidder, LA CSA |
| Champaign–Urbana, IL MSA | 242,453 | 236,072 | +2.70% | Champaign–Urbana–Danville, IL CSA |
| Macon-Bibb County, GA MSA | 237,617 | 233,802 | +1.63% | Macon-Bibb County–Warner Robins, GA CSA |
| Hilton Head Island–Bluffton–Port Royal, SC MSA | 237,393 | 215,908 | +9.95% | |
| Bellingham, WA MSA | 234,954 | 226,847 | +3.57% | |
| Fort Smith, AR-OK MSA | 232,848 | 227,213 | +2.48% | |
| Topeka, KS MSA | 232,648 | 233,152 | −0.22% | |
| Barnstable Town, MA MSA | 232,570 | 228,996 | +1.56% | Boston–Worcester–Providence, MA-RI-NH CSA |
| Rochester, MN MSA | 230,742 | 226,329 | +1.95% | Rochester–Austin–Winona, MN CSA |
| Lafayette–West Lafayette, IN MSA | 229,701 | 223,716 | +2.68% | Lafayette–West Lafayette–Frankfort, IN CSA |
| Burlington–South Burlington, VT MSA | 229,445 | 225,562 | +1.72% | Burlington–South Burlington–Barre, VT CSA |
| Las Cruces, NM MSA | 229,366 | 219,561 | +4.47% | El Paso–Las Cruces, TX-NM CSA |
| Charlottesville, VA MSA | 227,336 | 221,524 | +2.62% | |
| Lake Havasu City–Kingman, AZ MSA | 226,479 | 213,267 | +6.20% | |
| Panama City–Panama City Beach, FL MSA | 226,221 | 200,534 | +12.81% | |
| Athens-Clarke County, GA MSA | 223,689 | 215,415 | +3.84% | Atlanta–Athens-Clarke County–Sandy Springs, GA-AL CSA |
| Monroe, LA MSA | 221,921 | 227,147 | −2.30% | Monroe–Ruston, LA CSA |
| Gainesville, GA MSA | 221,745 | 203,136 | +9.16% | Atlanta–Athens-Clarke County–Sandy Springs, GA-AL CSA |
| Medford, OR MSA | 221,331 | 223,259 | −0.86% | Medford–Grants Pass, OR CSA |
| Yuma, AZ MSA | 220,310 | 203,881 | +8.06% | |
| Columbia, MO MSA | 219,426 | 210,864 | +4.06% | Columbia–Jefferson City–Moberly, MO CSA |
| Johnson City, TN MSA | 214,948 | 207,285 | +3.70% | Johnson City–Kingsport–Bristol, TN-VA CSA |
| Jacksonville, NC MSA | 212,954 | 204,576 | +4.10% | |
| Punta Gorda, FL MSA | 212,122 | 186,847 | +13.53% | North Port–Bradenton, FL CSA |
| Lexington Park, MD MSA | 211,382 | 206,560 | +2.33% | Washington–Baltimore–Arlington, DC-MD-VA-WV-PA CSA |
| Chico, CA MSA | 208,334 | 211,632 | −1.56% | |
| St. George, UT MSA | 207,943 | 180,279 | +15.35% | |
| Elkhart–Goshen, IN MSA | 207,436 | 207,047 | +0.19% | South Bend–Elkhart–Mishawaka, IN-MI CSA |
| Joplin, MO-KS MSA | 207,131 | 200,771 | +3.17% | Joplin–Miami, MO-OK-KS CSA |
| Springfield, IL MSA | 206,308 | 208,640 | −1.12% | Springfield–Jacksonville–Lincoln, IL CSA |
| Auburn–Opelika, AL MSA | 206,006 | 193,773 | +6.31% | Columbus–Auburn–Opelika, GA-AL CSA |
| St. Cloud, MN MSA | 205,878 | 199,671 | +3.11% | Minneapolis–St. Paul, MN-WI CSA |
| Warner Robins, GA MSA | 204,110 | 191,614 | +6.52% | Macon-Bibb County–Warner Robins, GA CSA |
| Charleston, WV MSA | 202,091 | 210,605 | −4.04% | Charleston–Huntington–Ashland, WV-OH-KY CSA |
| Florence, SC MSA | 200,474 | 199,964 | +0.26% | |
| Houma–Bayou Cane–Thibodaux, LA MSA | 199,206 | 207,137 | −3.83% | |
| Racine–Mount Pleasant, WI MSA | 198,651 | 197,727 | +0.47% | Milwaukee–Racine–Waukesha, WI CSA |
| Bowling Green, KY MSA | 195,159 | 179,639 | +8.64% | Bowling Green–Glasgow–Franklin, KY CSA |
| Dover, DE MSA | 192,690 | 181,851 | +5.96% | Philadelphia–Reading–Camden, PA-NJ-DE-MD CSA |
| Billings, MT MSA | 192,531 | 184,167 | +4.54% | |
| Midland, TX MSA | 188,766 | 175,220 | +7.73% | Midland–Odessa–Andrews, TX CSA |
| Coeur d'Alene, ID MSA | 188,323 | 171,362 | +9.90% | Spokane–Spokane Valley–Coeur d'Alene, WA-ID CSA |
| Saginaw, MI MSA | 187,714 | 190,124 | −1.27% | Saginaw–Midland–Bay City, MI CSA |
| Yuba City, CA MSA | 186,014 | 181,208 | +2.65% | Sacramento–Roseville, CA CSA |
| Abilene, TX MSA | 184,278 | 176,579 | +4.36% | Abilene–Sweetwater, TX CSA |
| Jackson, TN MSA | 183,680 | 180,504 | +1.76% | |
| Burlington, NC MSA | 183,040 | 171,415 | +6.78% | Greensboro–Winston-Salem–High Point, NC CSA |
| Kingston, NY MSA | 182,977 | 181,851 | +0.62% | New York–Newark, NY-NJ-CT-PA CSA |
| Iowa City, IA MSA | 182,711 | 175,419 | +4.16% | Cedar Rapids–Iowa City, IA CSA |
| Blacksburg–Christiansburg–Radford, VA MSA | 182,041 | 181,854 | +0.10% | |
| El Centro, CA MSA | 181,724 | 179,702 | +1.13% | |
| Redding, CA MSA | 181,121 | 182,155 | −0.57% | Redding–Red Bluff, CA CSA |
| Greenville, NC MSA | 180,783 | 170,243 | +6.19% | Greenville–Washington, NC CSA |
| Muskegon–Norton Shores, MI MSA | 177,428 | 175,824 | +0.91% | Grand Rapids–Wyoming, MI CSA |
| Eau Claire, WI MSA | 176,153 | 172,007 | +2.41% | Eau Claire–Menomonie, WI CSA |
| Oshkosh–Neenah, WI MSA | 173,307 | 171,730 | +0.92% | Appleton–Oshkosh–Neenah, WI CSA |
| Sebastian–Vero Beach–West Vero Corridor, FL MSA | 172,139 | 159,788 | +7.73% | Miami–Port St. Lucie–Fort Lauderdale, FL CSA |
| Bloomington, IL MSA | 172,069 | 170,954 | +0.65% | Bloomington–Pontiac, IL CSA |
| Idaho Falls, ID MSA | 171,233 | 157,429 | +8.77% | Idaho Falls–Rexburg–Blackfoot, ID CSA |
| La Crosse–Onalaska, WI-MN MSA | 170,763 | 170,341 | +0.25% | La Crosse–Onalaska–Sparta, WI-MN CSA |
| Homosassa Springs, FL MSA | 170,174 | 153,843 | +10.62% | |
| Waterloo–Cedar Falls, IA MSA | 170,081 | 168,461 | +0.96% | |
| Odessa, TX MSA | 170,022 | 165,171 | +2.94% | Midland–Odessa–Andrews, TX CSA |
| Pueblo, CO MSA | 169,866 | 168,162 | +1.01% | Pueblo–Cañon City, CO CSA |
| Terre Haute, IN MSA | 168,874 | 168,875 | 0.00% | |
| Kenosha, WI MSA | 168,754 | 169,151 | −0.23% | Chicago–Naperville, IL-IN-WI CSA |
| Janesville–Beloit, WI MSA | 165,461 | 163,687 | +1.08% | Madison–Janesville–Beloit, WI CSA |
| Amherst Town–Northampton, MA MSA | 165,399 | 162,308 | +1.90% | Springfield–Amherst Town–Northampton, MA CSA |
| Kahului–Wailuku, HI MSA | 163,769 | 164,836 | −0.65% | |
| Bloomington, IN MSA | 162,553 | 161,039 | +0.94% | Bloomington–Bedford, IN CSA |
| Grand Junction, CO MSA | 161,260 | 155,703 | +3.57% | |
| Logan, UT-ID MSA | 161,125 | 147,348 | +9.35% | |
| Jackson, MI MSA | 160,233 | 160,366 | −0.08% | |
| State College, PA MSA | 159,805 | 158,172 | +1.03% | State College–DuBois, PA CSA |
| Decatur, AL MSA | 159,651 | 156,494 | +2.02% | Huntsville–Decatur–Albertville, AL-TN CSA |
| Chambersburg, PA MSA | 159,285 | 155,932 | +2.15% | Washington–Baltimore–Arlington, DC-MD-VA-WV-PA CSA |
| Santa Fe, NM MSA | 157,765 | 154,823 | +1.90% | Albuquerque–Santa Fe–Los Alamos, NM CSA |
| Bangor, ME MSA | 156,840 | 152,199 | +3.05% | |
| Traverse City, MI MSA | 156,634 | 153,448 | +2.08% | |
| Hattiesburg, MS MSA | 156,575 | 153,891 | +1.74% | Hattiesburg–Laurel, MS CSA |
| Florence–Muscle Shoals, AL MSA | 156,287 | 150,791 | +3.64% | Florence–Muscle Shoals–Russellville, AL CSA |
| Rapid City, SD MSA | 156,227 | 147,392 | +5.99% | Rapid City–Spearfish, SD CSA |
| Monroe, MI MSA | 156,045 | 154,809 | +0.80% | Detroit–Warren–Ann Arbor, MI CSA |
| Vineland, NJ MSA | 155,678 | 154,152 | +0.99% | Philadelphia–Reading–Camden, PA-NJ-DE-MD CSA |
| Hanford–Corcoran, CA MSA | 154,913 | 152,486 | +1.59% | Fresno–Hanford–Corcoran, CA CSA |
| Dothan, AL MSA | 154,766 | 151,007 | +2.49% | Dothan–Enterprise–Ozark, AL CSA |
| Wildwood–The Villages, FL MSA | 154,693 | 129,752 | +19.22% | Orlando–Lakeland–Deltona, FL CSA |
| Niles, MI MSA | 152,703 | 154,316 | −1.05% | South Bend–Elkhart–Mishawaka, IN-MI CSA |
| Valdosta, GA MSA | 152,588 | 148,126 | +3.01% | |
| Jefferson City, MO MSA | 151,523 | 150,309 | +0.81% | Columbia–Jefferson City–Moberly, MO CSA |
| Sherman–Denison, TX MSA | 150,532 | 135,543 | +11.06% | Dallas–Fort Worth, TX-OK CSA |
| Wichita Falls, TX MSA | 149,869 | 148,128 | +1.18% | |
| Winchester, VA-WV MSA | 149,702 | 142,632 | +4.96% | Washington–Baltimore–Arlington, DC-MD-VA-WV-PA CSA |
| Alexandria, LA MSA | 148,008 | 152,192 | −2.75% | |
| Rocky Mount, NC MSA | 147,114 | 143,870 | +2.25% | Rocky Mount–Wilson–Roanoke Rapids, NC CSA |
| Dalton, GA MSA | 146,386 | 142,837 | +2.48% | Chattanooga–Cleveland–Dalton, TN-GA-AL CSA |
| Sioux City, IA-NE-SD MSA | 145,994 | 144,334 | +1.15% | Sioux City–Le Mars, IA-NE-SD CSA |
| Texarkana, TX-AR MSA | 145,576 | 147,519 | −1.32% | |
| Albany, GA MSA | 145,451 | 148,922 | −2.33% | |
| Lebanon, PA MSA | 145,319 | 143,257 | +1.44% | Harrisburg–York–Lebanon, PA CSA |
| Flagstaff, AZ MSA | 145,161 | 145,101 | +0.04% | |
| Morgantown, WV MSA | 142,752 | 140,038 | +1.94% | |
| Hammond, LA MSA | 139,823 | 133,157 | +5.01% | Baton Rouge–Hammond, LA CSA |
| Bismarck, ND MSA | 139,183 | 133,626 | +4.16% | |
| Wausau, WI MSA | 139,091 | 138,013 | +0.78% | Wausau–Stevens Point–Wisconsin Rapids, WI CSA |
| Harrisonburg, VA MSA | 138,838 | 135,571 | +2.41% | Harrisonburg–Staunton–Stuarts Draft, VA CSA |
| Jonesboro, AR MSA | 138,152 | 134,196 | +2.95% | Jonesboro–Paragould, AR CSA |
| Wheeling, WV-OH MSA | 135,136 | 139,513 | −3.14% | |
| Springfield, OH MSA | 134,985 | 136,001 | −0.75% | Dayton–Springfield–Kettering, OH CSA |
| Manhattan, KS MSA | 134,892 | 134,046 | +0.63% | |
| Battle Creek, MI MSA | 133,785 | 134,310 | −0.39% | Kalamazoo–Battle Creek–Portage, MI CSA |
| Mount Vernon–Anacortes, WA MSA | 132,736 | 129,523 | +2.48% | Seattle–Tacoma, WA CSA |
| Napa, CA MSA | 132,727 | 138,019 | −3.83% | San Jose–San Francisco–Oakland, CA CSA |
| Albany, OR MSA | 132,474 | 128,610 | +3.00% | Portland–Vancouver–Salem, OR-WA CSA |
| Cleveland, TN MSA | 132,120 | 126,164 | +4.72% | Chattanooga–Cleveland–Dalton, TN-GA-AL CSA |
| Salisbury, MD MSA | 131,570 | 128,208 | +2.62% | Salisbury–Ocean Pines, MD CSA |
| Johnstown, PA MSA | 130,108 | 133,472 | −2.52% | Johnstown–Somerset, PA CSA |
| Ames, IA MSA | 129,227 | 125,252 | +3.17% | Des Moines–West Des Moines–Ames, IA CSA |
| Pittsfield, MA MSA | 128,726 | 129,026 | −0.23% | |
| Staunton–Stuarts Draft, VA MSA | 128,481 | 125,433 | +2.43% | Harrisonburg–Staunton–Stuarts Draft, VA CSA |
| Elizabethtown, KY MSA | 127,954 | 125,569 | +1.90% | Louisville/Jefferson County–Elizabethtown, KY-IN CSA |
| Missoula, MT MSA | 127,741 | 122,457 | +4.31% | |
| Wenatchee–East Wenatchee, WA MSA | 127,023 | 122,012 | +4.11% | |
| Bozeman, MT MSA | 126,984 | 118,960 | +6.75% | |
| Morristown, TN MSA | 126,932 | 119,182 | +6.50% | Knoxville–Morristown–Sevierville, TN CSA |
| Lawton, OK MSA | 126,899 | 126,652 | +0.20% | Lawton–Duncan, OK CSA |
| Sierra Vista–Douglas, AZ MSA | 125,773 | 125,447 | +0.26% | |
| Glens Falls, NY MSA | 125,127 | 127,039 | −1.51% | Albany–Schenectady, NY CSA |
| Mansfield, OH MSA | 124,853 | 124,936 | −0.07% | Mansfield–Ashland–Bucyrus, OH CSA |
| Twin Falls, ID MSA | 122,565 | 114,283 | +7.25% | |
| Lawrence, KS MSA | 121,989 | 118,785 | +2.70% | Kansas City–Overland Park–Kansas City, MO-KS CSA |
| San Angelo, TX MSA | 121,629 | 121,516 | +0.09% | |
| Farmington, NM MSA | 120,817 | 121,661 | −0.69% | |
| Goldsboro, NC MSA | 120,338 | 117,333 | +2.56% | |
| Altoona, PA MSA | 120,269 | 122,822 | −2.08% | Altoona–Huntingdon, PA CSA |
| St. Joseph, MO-KS MSA | 119,124 | 121,467 | −1.93% | Kansas City–Overland Park–Kansas City, MO-KS CSA |
| Sheboygan, WI MSA | 118,331 | 118,034 | +0.25% | |
| Brunswick–St. Simons, GA MSA | 117,135 | 113,495 | +3.21% | |
| Anniston–Oxford, AL MSA | 116,427 | 116,441 | −0.01% | |
| Lewiston–Auburn, ME MSA | 115,272 | 111,139 | +3.72% | Portland–Lewiston–South Portland, ME CSA |
| Longview–Kelso, WA MSA | 113,982 | 110,730 | +2.94% | Portland–Vancouver–Salem, OR-WA CSA |
| Owensboro, KY MSA | 113,583 | 112,464 | +0.99% | |
| Sandusky, OH MSA | 113,533 | 115,986 | −2.11% | Cleveland–Akron–Canton, OH CSA |
| Weirton–Steubenville, WV-OH MSA | 113,239 | 116,903 | −3.13% | Pittsburgh–Weirton–Steubenville, PA-OH-WV CSA |
| Williamsport, PA MSA | 113,236 | 114,188 | −0.83% | Williamsport–Lock Haven, PA CSA |
| Watertown–Fort Drum, NY MSA | 113,140 | 116,721 | −3.07% | |
| Muncie, IN MSA | 112,951 | 111,903 | +0.94% | Indianapolis–Carmel–Muncie, IN CSA |
| Michigan City–La Porte, IN MSA | 111,348 | 112,417 | −0.95% | Chicago–Naperville, IL-IN-WI CSA |
| Beckley, WV MSA | 110,979 | 115,079 | −3.56% | |
| Sebring, FL MSA | 109,778 | 101,235 | +8.44% | |
| Pinehurst–Southern Pines, NC MSA | 108,417 | 99,727 | +8.71% | Fayetteville–Lumberton–Pinehurst, NC CSA |
| Gettysburg, PA MSA | 107,914 | 103,852 | +3.91% | Harrisburg–York–Lebanon, PA CSA |
| Kankakee, IL MSA | 106,410 | 107,502 | −1.02% | Chicago–Naperville, IL-IN-WI CSA |
| Ithaca, NY MSA | 105,602 | 105,740 | −0.13% | Ithaca–Cortland, NY CSA |
| Mankato, MN MSA | 105,193 | 103,566 | +1.57% | Mankato–New Ulm, MN CSA |
| Sumter, SC MSA | 104,776 | 105,556 | −0.74% | Columbia–Sumter–Orangeburg, SC CSA |
| Fond du Lac, WI MSA | 104,269 | 104,154 | +0.11% | |
| Grand Forks, ND-MN MSA | 104,184 | 104,362 | −0.17% | |
| Gadsden, AL MSA | 103,207 | 103,436 | −0.22% | |
| Bay City, MI MSA | 102,651 | 103,856 | −1.16% | Saginaw–Midland–Bay City, MI CSA |
| Paducah, KY-IL MSA | 102,395 | 103,486 | −1.05% | Paducah–Mayfield, KY-IL CSA |
| Cheyenne, WY MSA | 101,783 | 100,512 | +1.26% | |
| Rome, GA MSA | 101,390 | 98,584 | +2.85% | Atlanta–Athens-Clarke County–Sandy Springs, GA-AL CSA |
| Lima, OH MSA | 100,866 | 102,206 | −1.31% | Lima–Van Wert–Celina, OH CSA |
| Decatur, IL MSA | 100,737 | 103,998 | −3.14% | |
| Hot Springs, AR MSA | 99,902 | 100,180 | −0.28% | Hot Springs–Malvern, AR CSA |
| Dubuque, IA MSA | 99,242 | 99,266 | −0.02% | |
| Victoria, TX MSA | 99,170 | 98,331 | +0.85% | Victoria–Port Lavaca, TX CSA |
| Corvallis, OR MSA | 98,899 | 95,184 | +3.90% | Portland–Vancouver–Salem, OR-WA CSA |
| Cape Girardeau, MO-IL MSA | 98,862 | 97,517 | +1.38% | Cape Girardeau–Sikeston, MO-IL CSA |
| Helena, MT MSA | 96,735 | 89,832 | +7.68% | |
| Fairbanks–College, AK MSA | 94,951 | 95,655 | −0.74% | |
| Pocatello, ID MSA | 91,010 | 87,018 | +4.59% | |
| Hinesville, GA MSA | 89,046 | 81,424 | +9.36% | Savannah–Hinesville–Statesboro, GA CSA |
| Grants Pass, OR MSA | 88,276 | 88,090 | +0.21% | Medford–Grants Pass, OR CSA |
| Parkersburg–Vienna, WV MSA | 87,681 | 89,490 | −2.02% | Parkersburg–Marietta–Vienna, WV-OH CSA |
| Columbus, IN MSA | 84,741 | 82,208 | +3.08% | Indianapolis–Carmel–Muncie, IN CSA |
| Great Falls, MT MSA | 84,523 | 84,414 | +0.13% | |
| Kokomo, IN MSA | 84,082 | 83,658 | +0.51% | Indianapolis–Carmel–Muncie, IN CSA |
| Midland, MI MSA | 84,022 | 83,494 | +0.63% | Saginaw–Midland–Bay City, MI CSA |
| Elmira, NY MSA | 81,115 | 84,148 | −3.60% | Elmira–Corning, NY CSA |
| Casper, WY MSA | 80,410 | 79,955 | +0.57% | |
| Grand Island, NE MSA | 77,278 | 77,038 | +0.31% | |
| Minot, ND MSA | 75,938 | 77,546 | −2.07% | |
| Lewiston, ID-WA MSA | 65,370 | 64,375 | +1.55% | |
| Walla Walla, WA MSA | 62,068 | 62,584 | −0.82% | Kennewick–Richland-Walla Walla, WA CSA |
| Enid, OK MSA | 62,007 | 62,846 | −1.34% | |
| Eagle Pass, TX MSA | 58,829 | 57,887 | +1.63% | |
| Carson City, NV MSA | 58,148 | 58,639 | −0.84% | Reno–Carson City–Gardnerville Ranchos, NV-CA CSA |
Puerto Rico
This sortable table lists the six metropolitan statistical areas (MSAs) of Puerto Rico including:
- The MSA rank by population as of July 1, 2024, as estimated by the United States Census Bureau[16]
- The MSA name as designated by the United States Office of Management and Budget[6]
- The MSA population as of July 1, 2024, as estimated by the United States Census Bureau[16]
- The MSA population as of April 1, 2020, as enumerated by the 2020 United States census[16][a]
- The percent MSA population change from April 1, 2020, to July 1, 2024[16]
- The combined statistical area (CSA)[b] if the MSA is a component[17]
| Rank | Metropolitan statistical area | 2024 estimate | 2020 census[a] | Change | Encompassing combined statistical area |
|---|---|---|---|---|---|
| 1 | San Juan–Bayamón–Caguas, PR MSA | 2,035,484 | 2,081,265 | −2.20% | San Juan–Bayamón, PR Combined Statistical Area |
| 2 | Ponce, PR MSA | 265,039 | 278,477 | −4.83% | Ponce–Coamo, PR Combined Statistical Area |
| 3 | Aguadilla, PR MSA | 250,969 | 253,768 | −1.10% | Mayagüez–Aguadilla, PR Combined Statistical Area |
| 4 | Mayagüez, PR MSA | 207,205 | 213,831 | −3.10% | Mayagüez–Aguadilla, PR Combined Statistical Area |
| 5 | Arecibo, PR MSA | 180,071 | 182,705 | −1.44% | San Juan–Bayamón, PR Combined Statistical Area |
| 6 | Guayama, PR MSA | 64,546 | 68,442 | −5.69% | San Juan–Bayamón, PR Combined Statistical Area |
See also
- United States of America
- Outline of the United States
- Demographics of the United States
- United States Census Bureau
- List of U.S. states and territories by population
- List of United States cities by population
- List of United States counties and county equivalents
- United States Office of Management and Budget
- Statistical area (United States)
- Combined statistical area
- Core-based statistical area (list)
- Micropolitan statistical area
- Statistical area (United States)
- United States Census Bureau
Footnotes
- ^ a b c d Populations retroactively adjusted to account for new MSA delineations as redefined in 2023. This number reflects what the 2020 Census would have shown the population to be had the current delineated boundaries been in effect at the time of the 2020 Census.
- ^ a b The U.S.Office of Management and Budget (OMB) defines a CSA (CSA) as an aggregate of adjacent core-based statistical areas that are linked by commuting ties.
References
- ^ "Metropolitan Areas". US Census Bureau. Retrieved December 4, 2023.
- ^ "Glossary". United States Census Bureau. Archived from the original on July 10, 2023. Retrieved July 10, 2023.
- ^ Caves, R. W. (2004). Encyclopedia of the City. Routledge. pp. 459. ISBN 9780415252256.
- ^ Cox, Wendell (August 1, 2014). "Urban Cores, Core Cities and Principal Cities". newgeography.com. Archived from the original on July 10, 2023. Retrieved July 10, 2023.
- ^ Nussle, Jim (November 20, 2008). "Update of Statistical Area Definitions and Guidance on Their Uses" (PDF). Office of Management and Budget. pp. 1–2. Archived (PDF) from the original on January 21, 2017.
- ^ a b c d Executive Office of the President (July 21, 2023). "Revised Delineations of Metropolitan Statistical Areas, Micropolitan Statistical Areas, and Combined Statistical Areas, and Guidance on Uses of the Delineations of These Areas" (PDF) (Press release). Archived (PDF) from the original on July 21, 2023. Retrieved July 21, 2023.
- ^ Census Geographic Glossary Archived September 27, 2012, at the Wayback Machine, U.S. Census Bureau
- ^ a b c "2020 Standards for Delineating Core Based Statistical Areas". Federal Register. National Archives and Records Administration. July 16, 2021. Retrieved February 6, 2024.
- ^ "Metropolitan and Micropolitan Statistical Areas". U.S. Census Bureau. Archived from the original on September 23, 2011. Retrieved February 16, 2010.
- ^ "Glossary". US Census Bureau. Retrieved October 11, 2025.
- ^ "Recommendations From the Metropolitan and Micropolitan Statistical Area Standards Review Committee to the Office of Management and Budget Concerning Changes to the 2010 Standards for Delineating Metropolitan and Micropolitan Statistical Areas". Federal Register. January 19, 2021. Archived from the original on January 20, 2021. Retrieved January 21, 2021.
- ^ The White House (July 13, 2021). "Office of Management and Budget Announces 2020 Standards for Delineating Core Based Statistical Areas" (Press release). Archived from the original on July 16, 2021. Retrieved July 17, 2021.
- ^ a b c d Gardner, Todd (February 2021). Changes in Metropolitan Area Definition, 1910–2010 (PDF). Center for Economic Studies (Report). United States Census Bureau. pp. 5–6, 12. Retrieved January 26, 2024.
- ^ a b "History: Metropolitan Areas". United States Census Bureau. Retrieved January 26, 2024.
- ^ "Census Makes a 'Metropolis'". Seattle Post-Intelligencer. December 28, 1980. p. E2.
- ^ a b c d e f g h i "Metropolitan and Micropolitan Statistical Areas Population Totals: 2020-2024". United States Census Bureau, Population Division. March 13, 2025. Retrieved March 13, 2025.
- ^ a b "OMB Bulletin No. 20-01: Revised Delineations of Metropolitan Statistical Areas, Micropolitan Statistical Areas, and Combined Statistical Areas, and Guidance on Uses of the Delineations of These Areas" (PDF). United States Office of Management and Budget. March 6, 2020. Archived (PDF) from the original on June 12, 2021. Retrieved April 24, 2020.